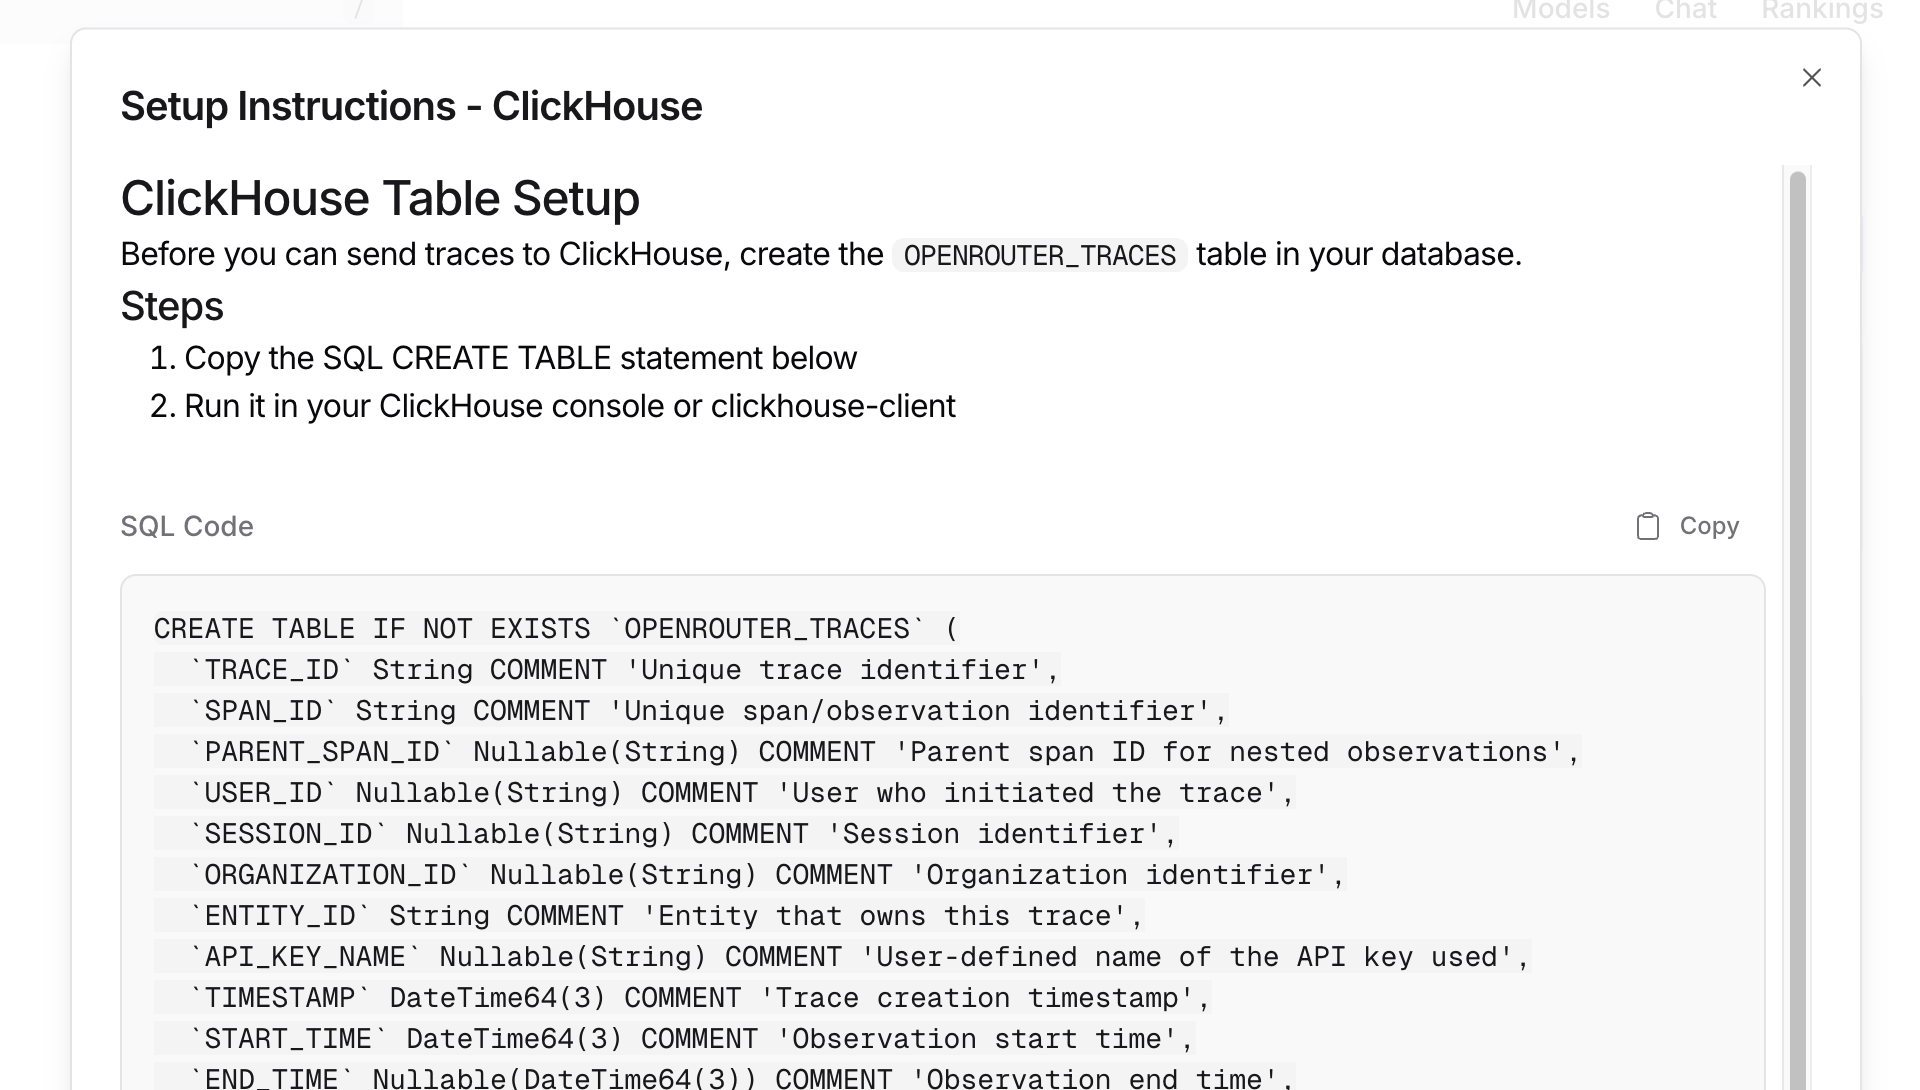
TRACE_ID | String | Trace identifier shared by all observations in a trace. |
SPAN_ID | String | Unique identifier for this observation. |
PARENT_SPAN_ID | Nullable(String) | Parent observation identifier, or NULL for an unparented observation. |
USER_ID | Nullable(String) | End-user identifier from the request. |
SESSION_ID | Nullable(String) | Session identifier used to group related requests. |
ORGANIZATION_ID | Nullable(String) | Organization that owns the trace. |
ENTITY_ID | String | Entity that owns the trace. |
API_KEY_NAME | Nullable(String) | User-defined name of the API key used for the request. |
TIMESTAMP | DateTime64(3) | Trace creation timestamp. |
START_TIME | DateTime64(3) | Observation start time. |
END_TIME | Nullable(DateTime64(3)) | Observation end time, or NULL when unavailable. |
DURATION_MS | Nullable(Float64) | Observation duration in milliseconds. |
MODEL | Nullable(String) | Model name used for the observation. |
PROVIDER_NAME | Nullable(String) | Provider name for the observation. |
PROVIDER_SLUG | Nullable(String) | Provider slug identifier. |
STATUS | String | ok or error; error is emitted only when LEVEL is ERROR. |
LEVEL | String | Observation level: DEBUG, INFO, DEFAULT, WARNING, or ERROR. |
FINISH_REASON | Nullable(String) | Completion finish reason, such as stop or length; not an enum. |
PROMPT_TOKENS | UInt64 | Input/prompt token count. |
COMPLETION_TOKENS | UInt64 | Output/completion token count. |
TOTAL_TOKENS | UInt64 | Total token count. |
CACHED_TOKENS | UInt64 | Cached prompt token count. |
CACHE_WRITE_TOKENS | Nullable(UInt64) | Prompt tokens written to the provider prompt cache. Added in schema version 2; tables created from version 1 don’t have this column. NULL when the provider did not report them, or when the destination’s Include cache_write_tokens setting is off. The setting is off by default; turn it on after the table has this column. |
REASONING_TOKENS | UInt64 | Reasoning/thinking token count. |
INPUT_COST | Decimal(18, 8) | Input cost in USD. |
OUTPUT_COST | Decimal(18, 8) | Output cost in USD. |
TOTAL_COST | Decimal(18, 8) | Total cost in USD. |
INPUT_UNIT_PRICE | Nullable(Decimal(18, 10)) | Price per input token in USD. |
OUTPUT_UNIT_PRICE | Nullable(Decimal(18, 10)) | Price per output token in USD. |
SPAN_TYPE | String | Observation type: GENERATION, SPAN, or EVENT. |
SPAN_KIND | String | Derived from SPAN_TYPE: GENERATION → llm, EVENT → tool, and SPAN → workflow. |
OPERATION_NAME | String | Operation type derived from the API surface, such as chat, embeddings, or image_generation. |
ATTRIBUTES | Nullable(String) | OpenTelemetry-style attributes for compatibility, serialized as JSON. |
INPUT | Nullable(String) | Input data, such as request messages, serialized as JSON. |
OUTPUT | Nullable(String) | Output data, such as response messages, serialized as JSON. |
METADATA | Nullable(String) | Combined custom, request, guardrail, and provider-attempt metadata as JSON. |
TAGS | Array(Nullable(String)) | Trace tags array. |
MODEL_PARAMETERS | Nullable(String) | Model parameters, such as temperature, serialized as JSON. |
RESOURCE_ATTRIBUTES | Nullable(String) | Resource attributes, including service.name and the Broadcast source, serialized as JSON. |
SCHEMA_VERSION | UInt16 | Broadcast schema version; currently defaults to 2. |